Authors: Faruk Gulban | Copyeditor: Lea Maria Ferguson | Published: March 2019
A layered cake is the tastiest way to study layer-MRI.
Let me explain…
The human cortex is commonly described as consisting of several layers. These layers are claimed to help us understand ‘how the brain works’. Understanding the functioning of the brain will probably be a vital prerequisite for creating cool robots. Therefore it can be considered a valuable endeavor. At least, this is my train-of-thought to justify the time I spend on understanding cortical layers.
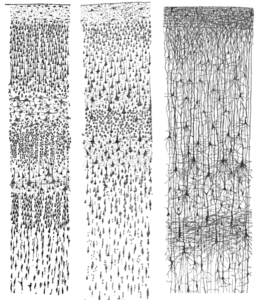
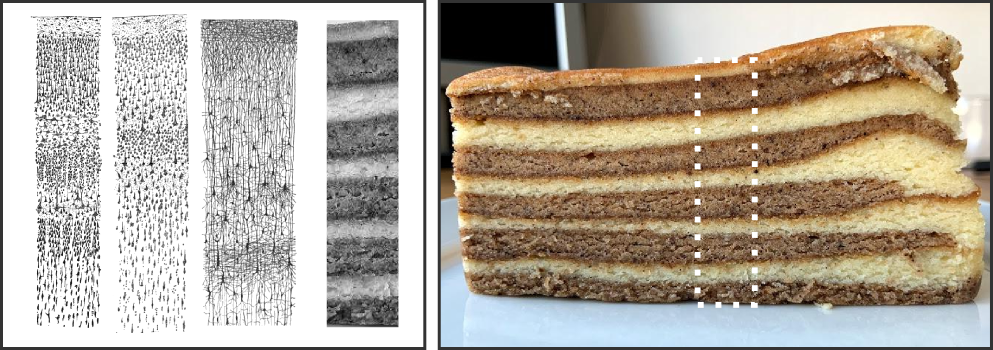
Before studying the function of the cortical layers though, one should first know where they are located and what they look like. Knowing the spatial composition of the aforementioned layers across brain regions and what they do at the same time is no easy task. In the past, people studied these layers by examining samples of the human brain (post-mortem). You can see a hand drawn picture of these layers in Figure 1. The method of taking-a-sample-out-to-have-a-look comes with a problem though. The layer structure is clearly visible; however, studying their function is impossible, since the owner of the brain is ~probably~ not functioning anymore.
Luckily, recent developments in MRI allow having a look at the functioning cortical layers without extracting samples. Good news for the living. Layer-MRI field is built on studying cortical layers in living humans and thus has no shortage of interesting aspects to investigate. In this post, I am going to talk about a small part of layer-MRI that I am currently struggling to understand. I am going to use a cake for this. So you can stay for the cake if nothing else.
Layers of voxels
A layer-MRI paper I enjoy to read is from Koopmans, Barth, Orzada, Norris (2011). There is a paragraph in their methods section that states:
“In our experiment, the primary visual cortex is approximately three voxels thick. The average profiles … however are very smooth and hence appear to be highly interpolated versions of (effectively) three-point data… This smoothness is caused by a partial volume effect when averaging all profiles together. The voxel grid is arbitrarily oriented with respect to … the cortex (i.e. [I] a voxel boundary may or may not be aligned with a tissue boundary, [II] voxel and tissue boundaries may intersect at an arbitrary angle, etc.). Therefore … all voxels together will uniformly sample the cortical depth (as opposed to only sampling the cortex at three depths).”
I have trouble understanding the full implications of [I] and [II]. Here I will focus on the first one and save the second for a future post.
What were to happen should a voxel boundary completely misalign (or align) with a tissue boundary?
To attempt to answer this question, I came up with the following thought experiment:
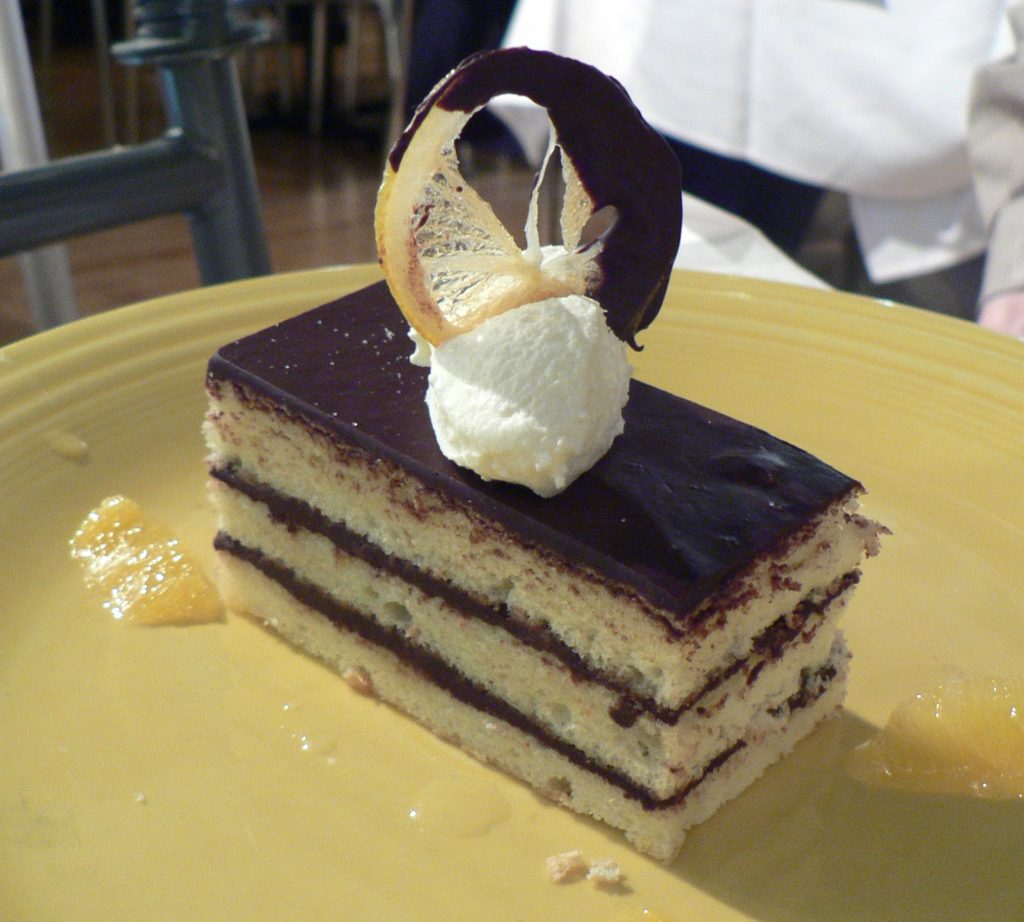
- Imagine an ideal cake that is perfectly shaped and baked evenly with sharply contrasting layers within.
- Imagine taking a sideways profile photo of a slice from this cake.
- Also imagine that your camera does not have a very high resolution. However the pixels are small enough for the pixel height to equal the thickness of the cake layers (from your viewing position).
- On top, your hands are shaking so you are shifting the camera just a tiny bit each time (I have used Hilbert space-filling curve to simulate these shifts).
Figure 3. Grid alignment strongly effects the fidelity of the sampled image when the scale (dimensions) of pixels and image features are close.
As you can see in Figure 2, the blurring of of the boundaries and their alignment due to the moment-to-moment mixture of material within each pixel affects the sampled image fidelity. This problem is analogous to the partial voluming problem in MRI. Due to partial voluming, pure black and white layers of the cake appear to be mixed with one another. The sharpest possible contrast appears only when the pixels forming the sampling grid align perfectly with the underlying object’s boundaries (see Figure 3). Thus although there is always some partial voluming, loss of image contrast depends on the alignment of the sampling grid with regards to the object’s boundaries. Henceforth, I will call this the grid alignment problem. The grid alignment problem includes the partial voluming and on top of this, indicates that the partial voluming is especially bad (or good) depending on the alignment of the grid with the object.
After observing the grid alignment problem, I wanted to measure the quality of the grid alignment. To do this, I came up with the following set-up:
- Imagine a line that is perpendicular to the surface of the ideal cake image.
- Do the same for the sampled image.
- Plot the pixel intensities along both lines and measure how similar these two lines (I have used mean Hausdorff distance as my measure). Repeat this for each time a tiny grid shift happens.
- Plot the measured similarity as a function of grid shifts in the directions of left-right and down-up.
Figure 4.
As you can see in Figure 4 Panel 3, the ideal and the sampled layer profiles vary considerably even in this ridiculously idealized case of maximally contrasted straight layers. Another interesting view emerges in Figure 3 Panel 4, where the quality of grid alignment is plotted as a function of bi-directional shifts. The dark regions indicate more similarity (i.e. less distance between ideal and sampled profile lines) while the white regions indicate less similarity (i.e. more distance between ideal and sampled profile lines).
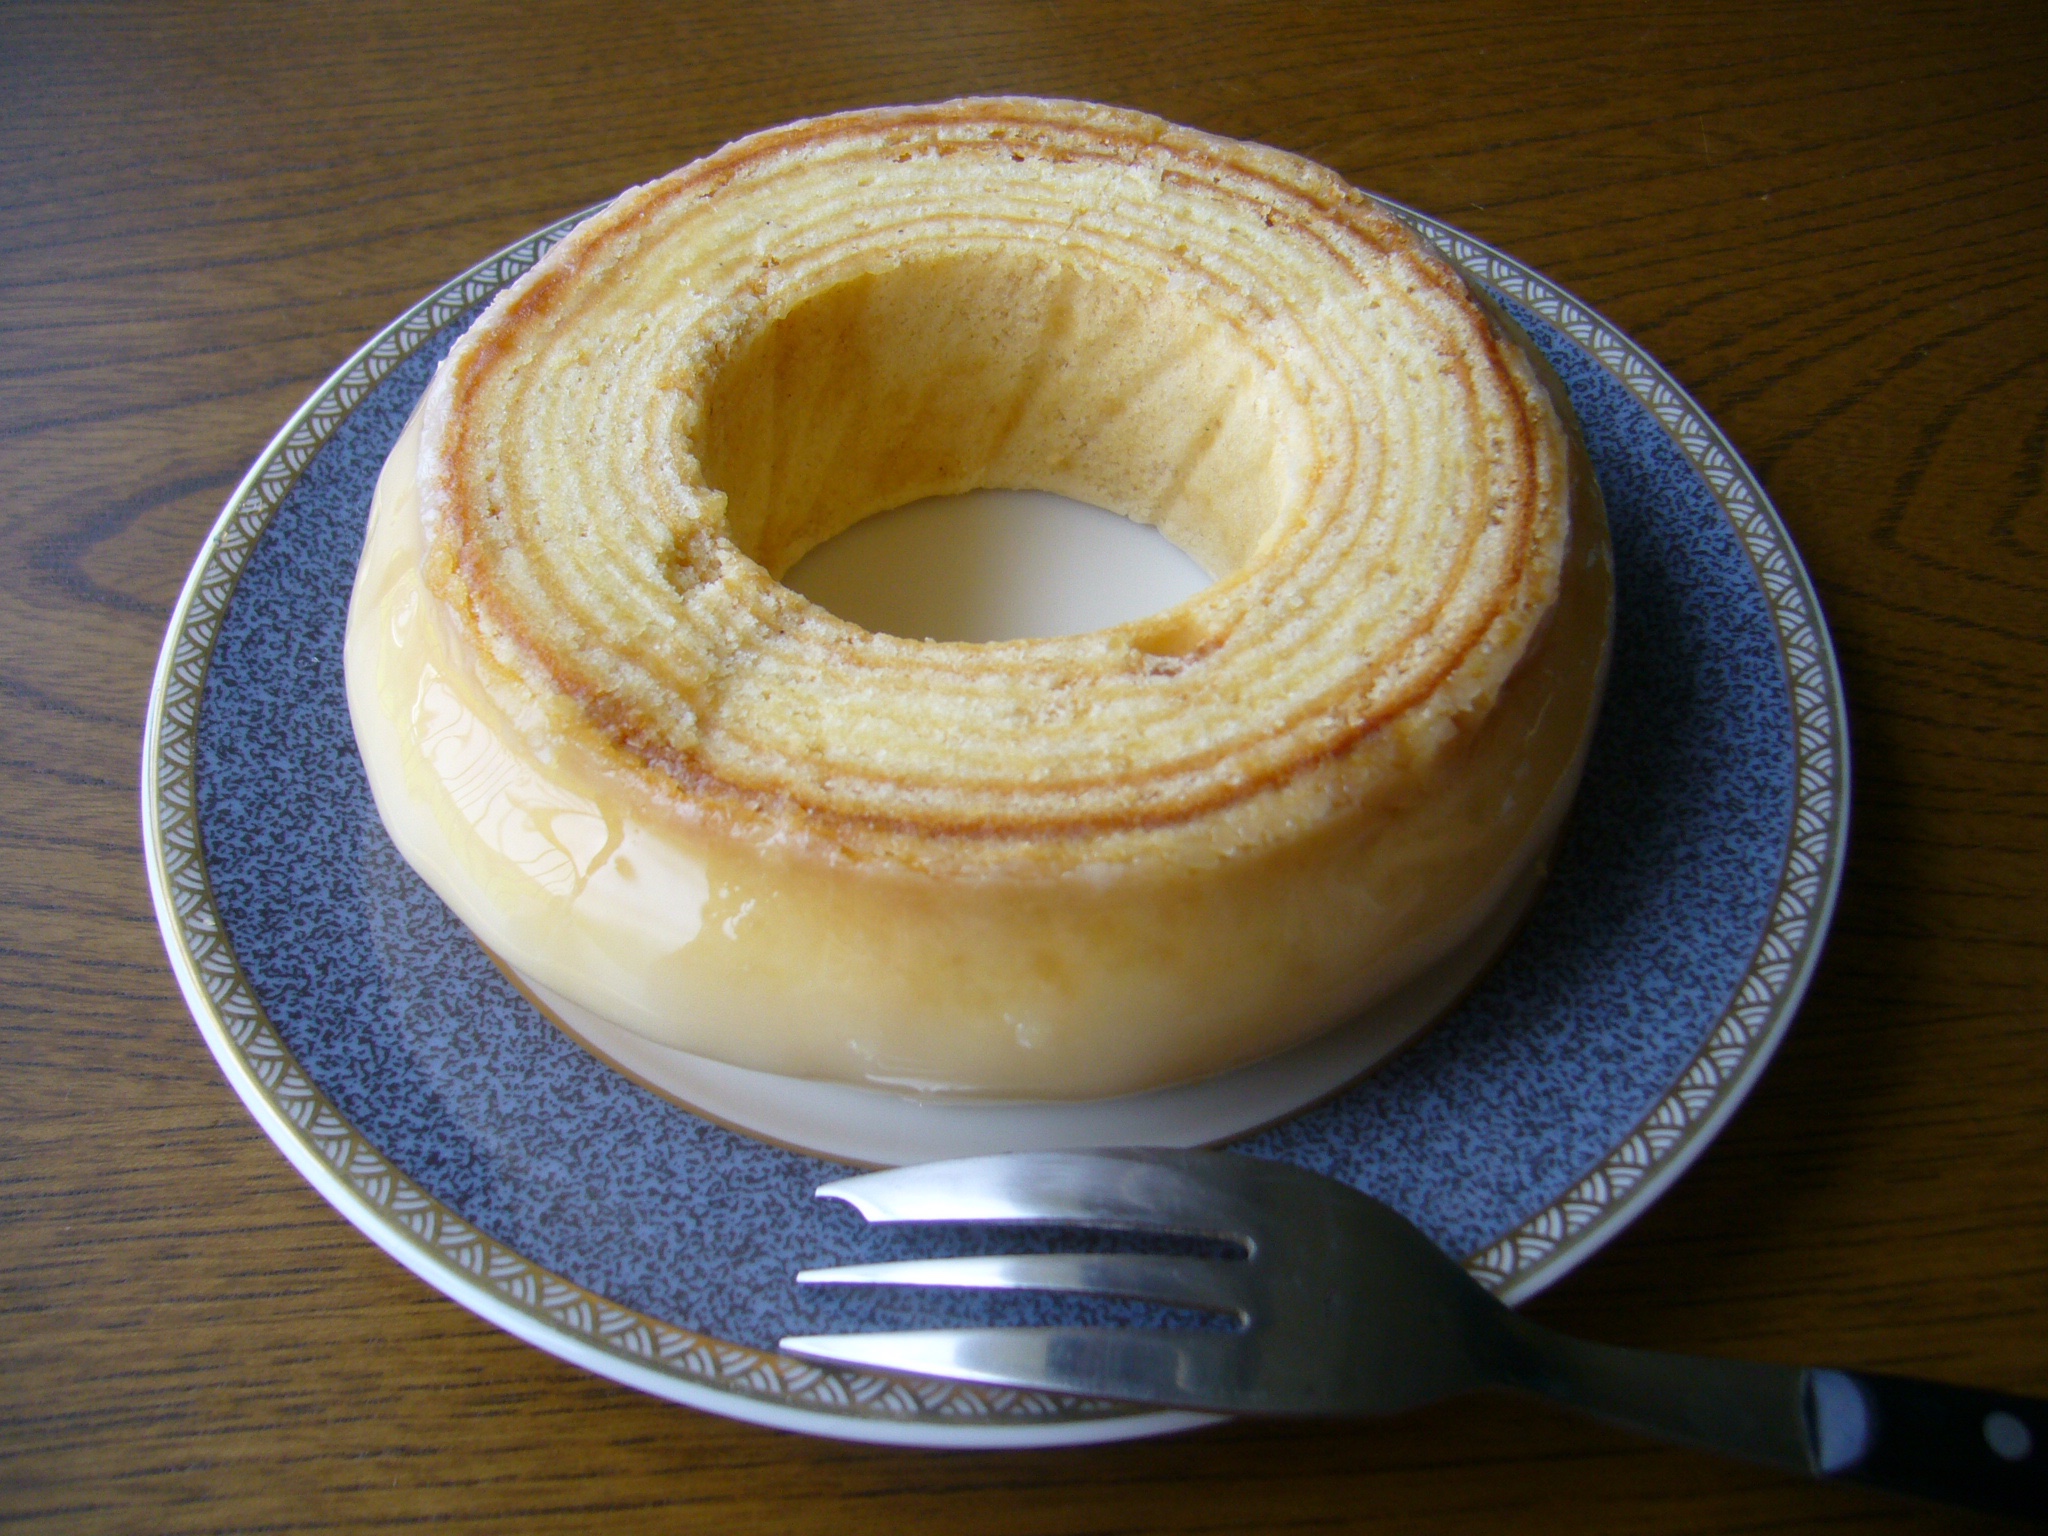
A somewhat more realistic scenario would involve variations in the layer thickness. To investigate this, I photographed a slice of cake from the side:
Figure 5.
You can see that the white, thick layer of the cake close to the white circle has actually been captured from time to time. This can be explained by the thickness of this cake layer approximately corresponding with the scale of the sampling grid pixels. However, the deeper, thinner layers are much more intertwined and thus barely visible most of the time.
Figure 6. Best and worst cases.
See how the white cake layer around green line disappears in the worst case in Figure 6.
This disappearance indicates locally bad grid alignment. It seems that the quality of grid alignment severely affects local fidelity of the sampled image. I have used the word local here because layer-MRI researchers seem to work around this issue by considering global layer profiles. This is achieved by averaging numerous profile lines over a large part of the image. Imagine many of these green lines next to one another.
A game of voxels
Obviously, the human cortex is not a straight and evenly baked layer-cake and I have mostly ignored the MRI part of the story. I am planning to further sophisticate to this thought experiment in the next post. For example, by using a curved layer cake next time:
Until then, eet smakelijk.
References
These are a few sources that I have enjoyed reading and get inspiration from while writing this:
- Koopmans, P. J., Barth, M., Orzada, S., & Norris, D. G. (2011). Multi-echo fMRI of the cortical laminae in humans at 7T. NeuroImage, 56(3), 1276–1285. [Effective resolution section]
- Polimeni, J. R., Fischl, B., Greve, D. N., & Wald, L. L. (2010). Laminar analysis of 7T BOLD using an imposed spatial activation pattern in human V1. NeuroImage, 52(4), 1334–1346. [Partial volume effects as a function of cortical depth section]
- Polimeni, J. R., Renvall, V., Zaretskaya, N., & Fischl, B. (2017). Analysis strategies for high-resolution UHF-fMRI data. NeuroImage, (April), 1–25. [Figure 5]
- For people mainly interested in human cortical layers, there is an excellent open dataset called BigBrain.
Visuals
Images and animations that are not referenced above have been created by the author and licensed under CC BY 4.0 license.